Author: Kjerstin Oh

  • Methods of Iteration: Written Response

    Methods of Iteration: Written Response

    This is the written response to my Methods of Iteration project. The work from previous weeks can be seen here: Week 1 and Week 2


    Raymond Queneau’s Exercises in Style (1947) is a highly entertaining book, which seems counterintuitive given that the premise — telling the same rather mundane story 99 times in different styles — sounds, on paper, exceedingly dull. I approached my Methods of Iteration project in much the same way. Whether I have achieved quite the same level of entertainment is for the viewer to decide.

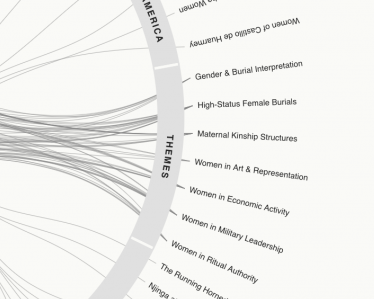
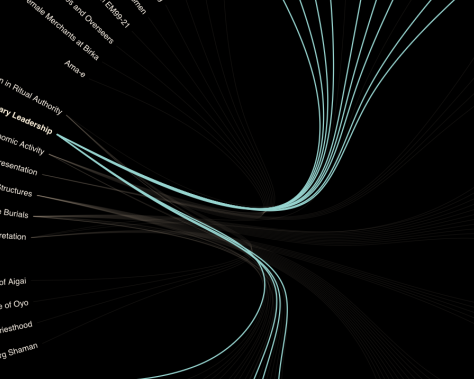
    In attempting to familiarise myself with the JavaScript library D3.js, I have effectively translated the same archaeological dataset into a variety of visual languages. Much like Queneau’s exercises, each version emphasises different aspects of the same material. A sunburst creates hierarchies, a chord diagram reveals relationships, while a map introduces geographical context. The information remains largely unchanged, but the story it tells can be surprisingly different.

    I don’t think this project would have been possible without a dataset I was already deeply familiar with. Queneau’s mastery of language allows him to manipulate his narrative through different dialects, perspectives and literary conventions. Similarly, understanding my data was essential to translating it into visual forms. D3 is not simply a library of ready-made visualisations into which you drop your data and et voilà! You need to explain how to read it, which relationships are meaningful, and how the information should be organised. Preparing the data is a substantial part of the work, and these decisions are not only technical, they influence what the viewer ultimately understands.

    My considerably less sophisticated understanding of JavaScript made the process rather slow going. Each visualisation required adjustments to both the data and the code, and attempts to shortcut the process using AI frequently introduced more problems than they solved. As a side experiment, I uploaded my prepared dataset to ChatGPT and asked it to create a force-directed graph. The result was nonsense. It became apparent that generating a visualisation is not the same as understanding what it represents.

    What I hadn’t anticipated was how much the process would reveal about the way I had assembled and organised my research. Some visualisations exposed geographical gaps in the dataset, others highlighted inconsistent categorisation, while certain beautifully intricate diagrams obscured more information than they communicated. Rather than uncovering entirely new knowledge about my subject, the process exposed weaknesses and assumptions within the research I had already conducted.

    This is where iteration became more interesting than variation. Each experiment informed the next, not only improving my understanding of the software but changing the questions I asked of the information itself. Queneau demonstrates how transforming the language of a story transforms our experience of it. My experiments suggest that visualisation can also become a means of interrogating how that story has been constructed.

    I used the data to understand D3, and ended up using D3 to understand the data.


    References

    Queneau, R. (1947) Exercises in style. John Calder, 1998.

  • Methods of Iterating: week 2

    Methods of Iterating: week 2

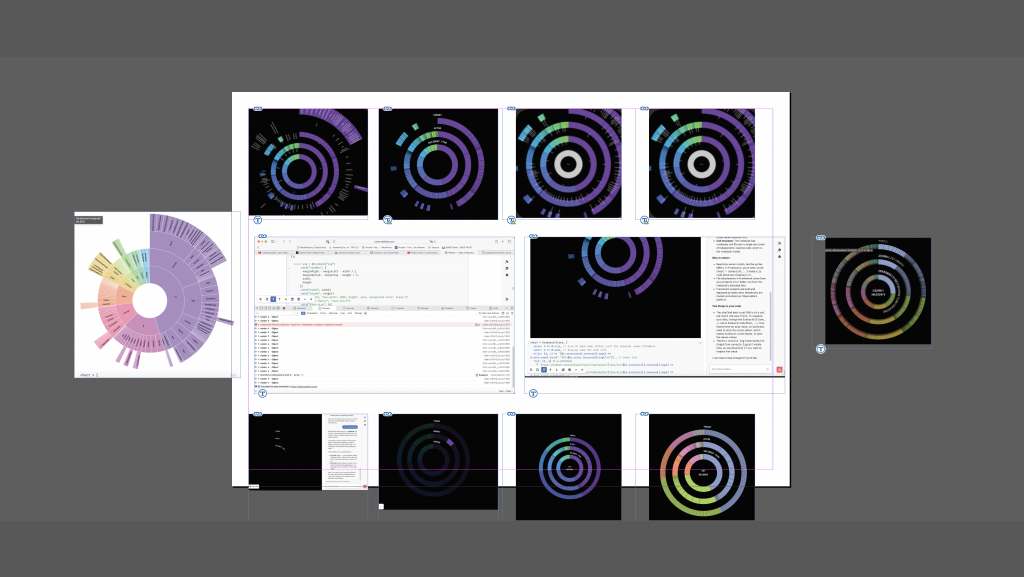
    I’d like to start by debunking the idea that coding is easy. Well, more specifically, that coding is now easy with the advent of AI. Or at least it isn’t within a structure like D3.js. I feel like I am dreaming in syntax errors. All in all, I made more than 25 iterations; I will share my most meaningful ones here.
    The question I chose to interrogate was: To what extent does data visualisation communicate what we already believe, and to what extent can it reveal what we don’t yet know? How does attaching the same data to a map, chart, scatterplot or beeswarm change what we see?

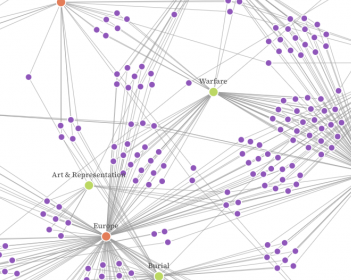
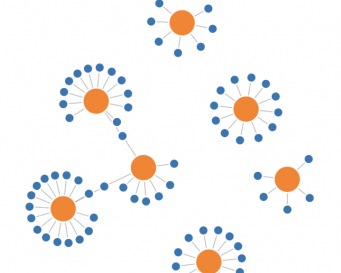
    This is a force-directed diagram, and I find it one of the most intriguing iterations. At first glance, it might not reveal much, but its almost sentient quality and multiple levels of interaction draw you in. Rather than making information immediately understandable, it invites exploration and play, potentially revealing more through interaction than observation alone.

    I was interested in whether changing the way information is presented could fundamentally change my understanding of it. Would different visualisations reveal relationships, patterns or discrepancies I hadn’t previously considered? Or would they simply reinforce the assumptions already embedded in the dataset?

    I wanted to understand whether data visualisation could help challenge assumptions, or whether the process of constructing the visualisation would inevitably introduce another layer of interpretation.

    I chose D3 because it was already on my radar as something that might be useful to me beyond this project. I still believe that to be true, but perhaps with some important caveats..

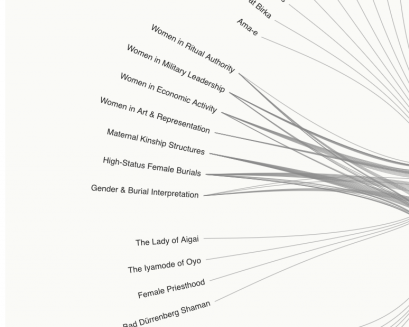
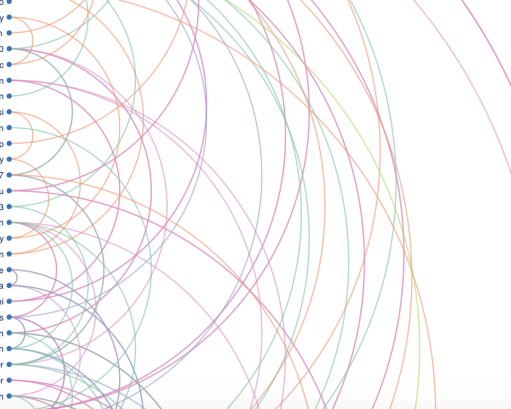
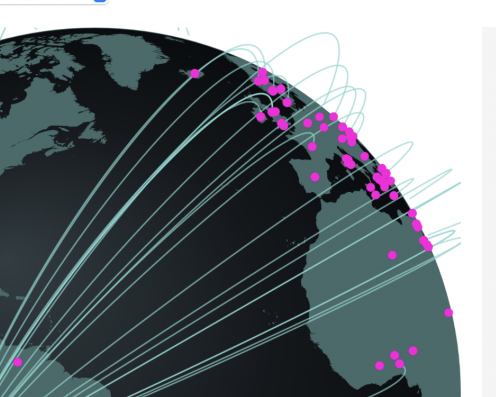
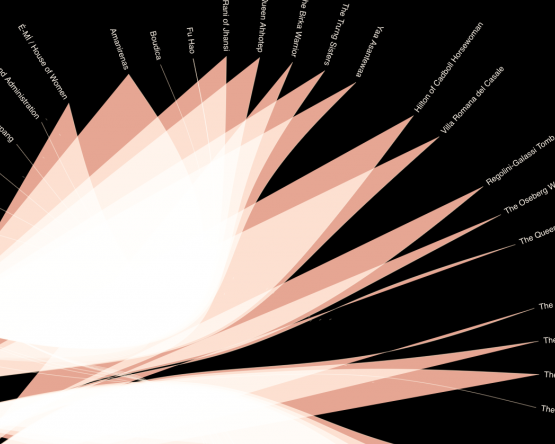
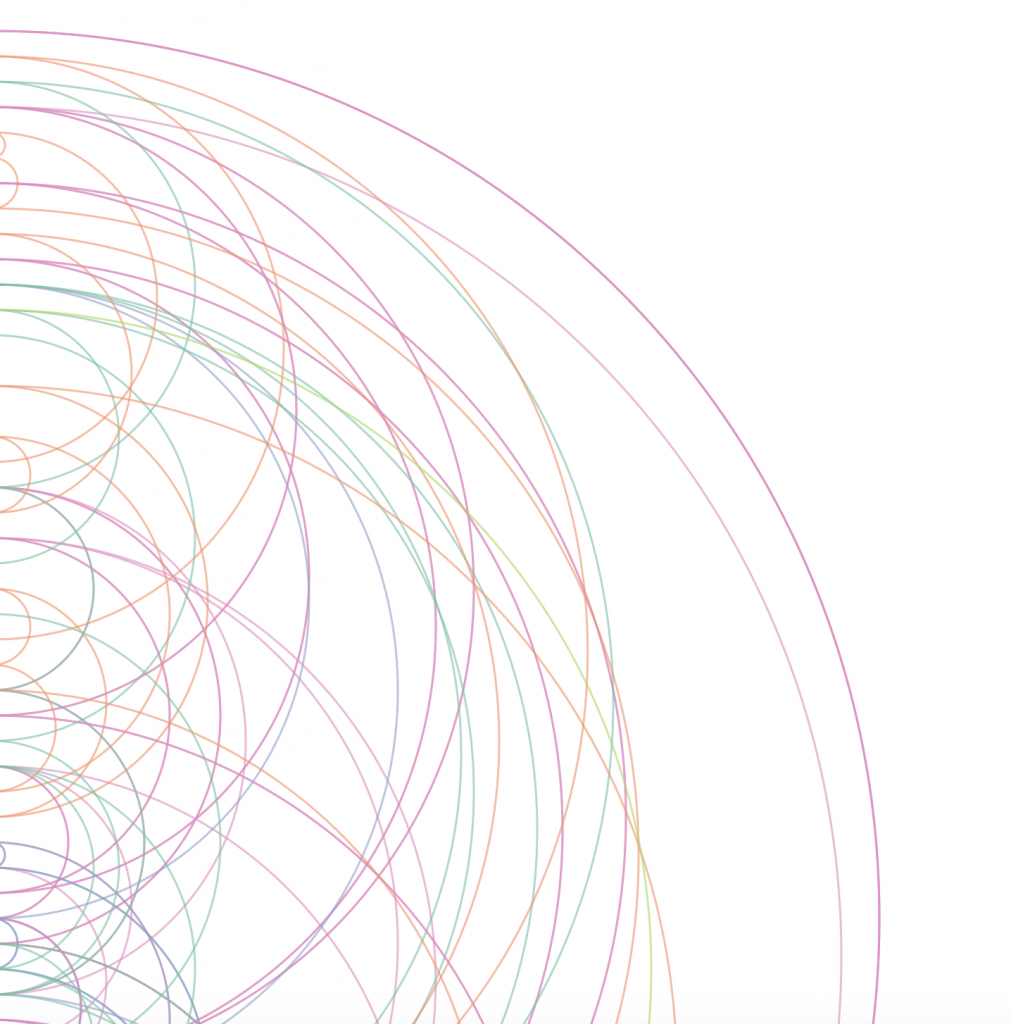
    This arc diagram visualises relationships within the dataset, revealing connections, clusters, density, and patterns. Like the force-directed diagram, it invites interaction and exploration, which I believe encourages viewers to spend more time with the data and potentially discover relationships they might otherwise overlook.

    One of the takeaways from this project is that a library like D3 only offers endless possibilities if you know what those possibilities are and how to access them. That in itself is quite a steep learning curve. I feel like I might have cracked the door open and now have a narrow view into this world, but the sliver is still thin.

    I also no longer believe that using data visualisation as a research tool will necessarily reveal things I didn’t already know. As the person preparing the data and determining how it is represented, I am inevitably influencing what I might discover. That doesn’t mean unexpected patterns can’t emerge, but perhaps its greater value lies in testing hypotheses, questioning assumptions, and identifying where further investigation is needed.

    You have to make choices when preparing your data; otherwise, it is unreadable to D3. These choices are never without bias, so you are essentially determining what the visualisation can reveal and what it will obscure.

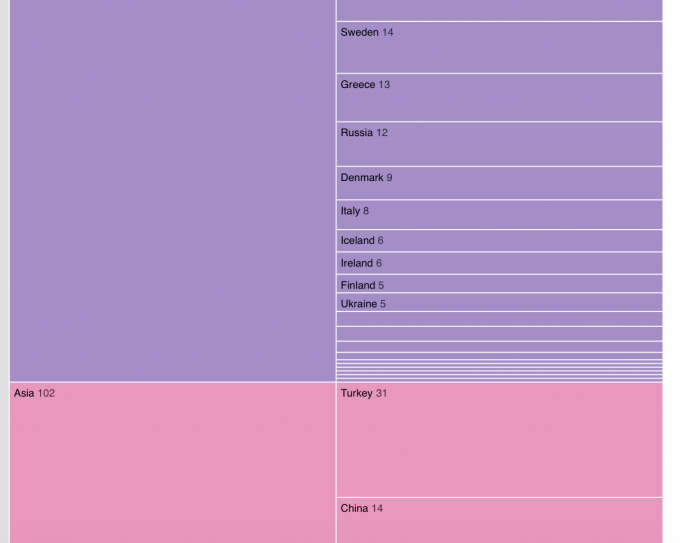
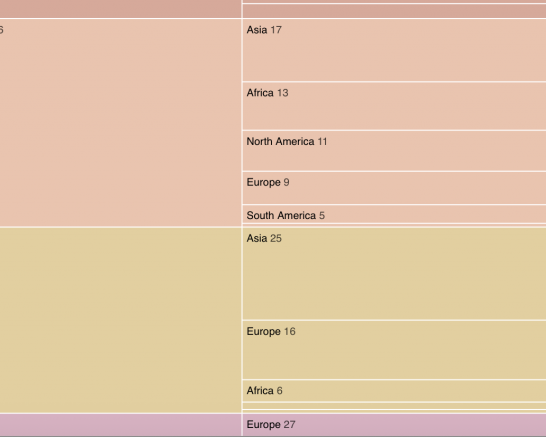
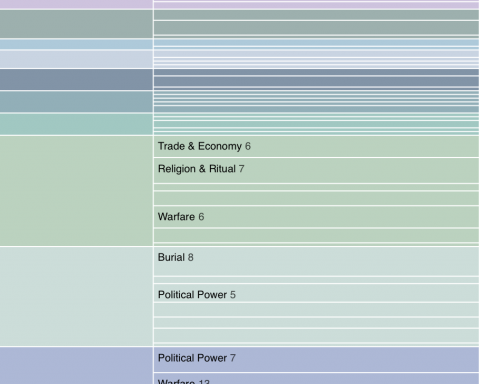
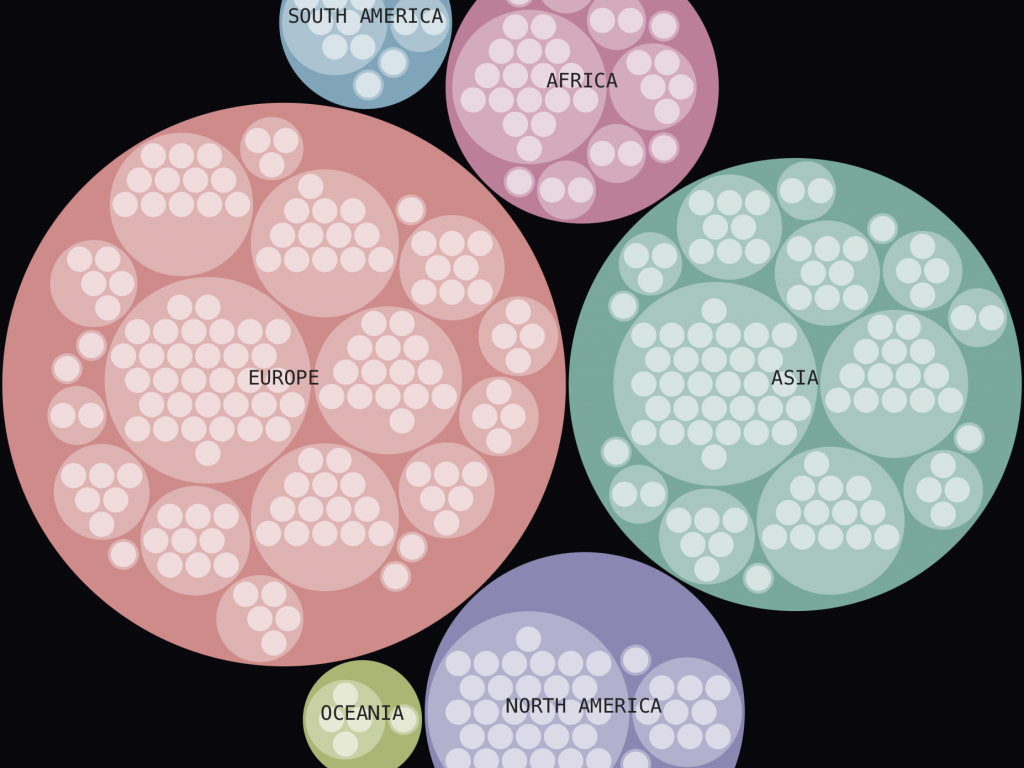
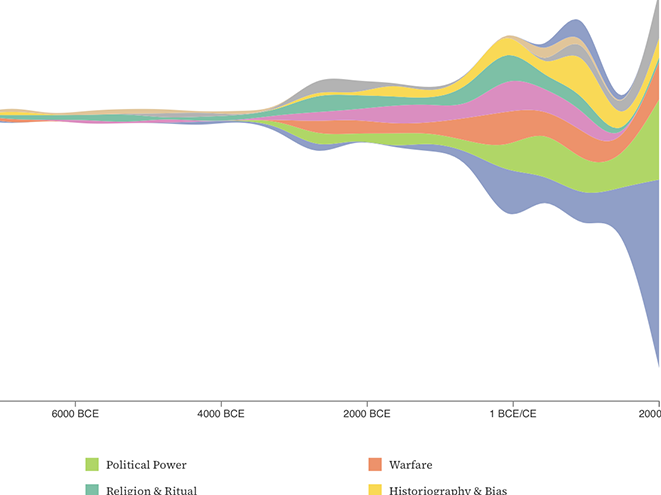
    This is a zoomable icicle chart. Unlike the previous examples, it is less concerned with connections and patterns and more with volume and relative weighting. It is immediately readable, yet retains some of the playful, interactive qualities of the other diagrams. Perhaps most interestingly, it reveals something about the creator’s decisions: how the data is organised, what is given prominence and, ultimately, what is considered important.

    This became particularly apparent when I began comparing the different iterations. The same dataset could appear to tell quite different stories depending on whether I organised it geographically, hierarchically or through relationships. None of these representations was necessarily incorrect, but each emphasised something different. The visualisation wasn’t simply revealing the data; it was also revealing the decisions I had made about how to present it.

    Even when a visualisation exposes a discrepancy I hadn’t predicted, I still don’t know how that discrepancy occurred. Is it my own bias? Is it a lack of data from the field? Is there a wider bias within the area I am studying?

    All of these are further questions that the visualisation cannot answer. It can interrogate a question, but ultimately it may answer with another question, which is then up to me to interpret.

    In that way, it becomes more of a dialogue. And perhaps that brings me back to where I started. D3 can generate visualisations without necessarily explaining what they reveal. It can produce results, but it can’t do the understanding for me.

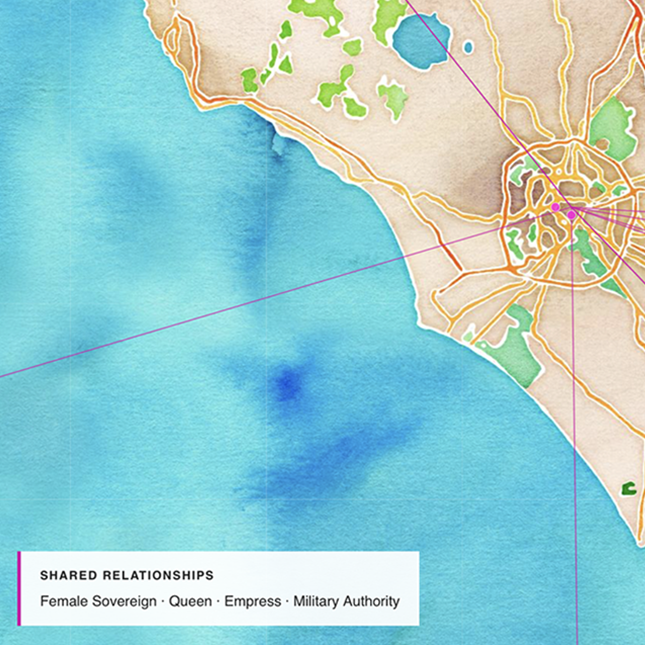
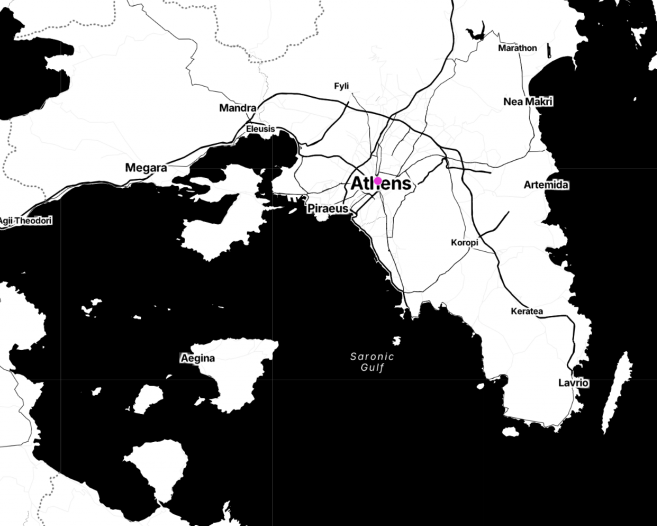
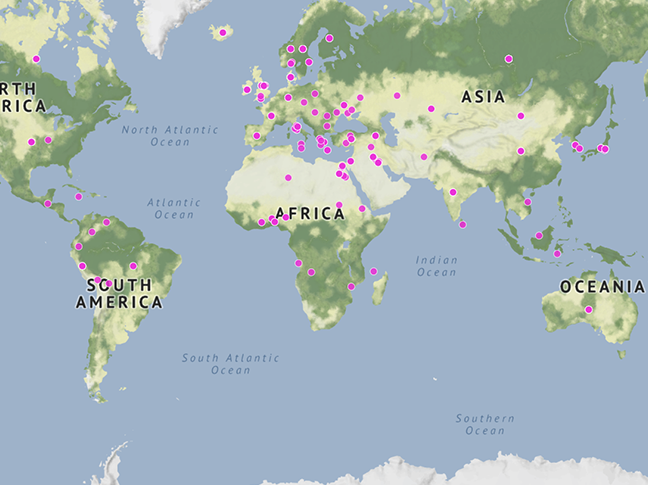
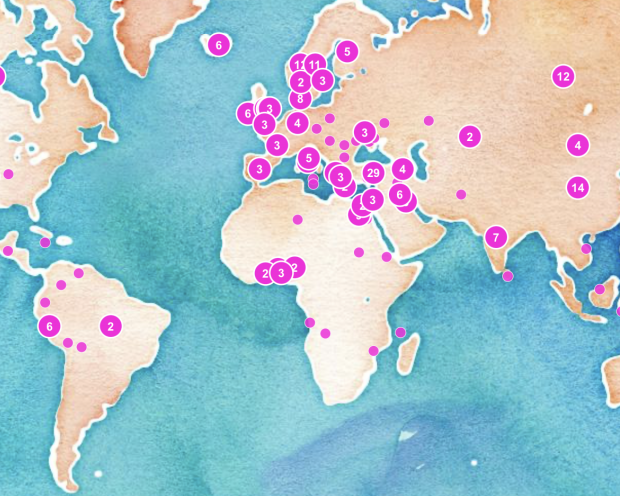
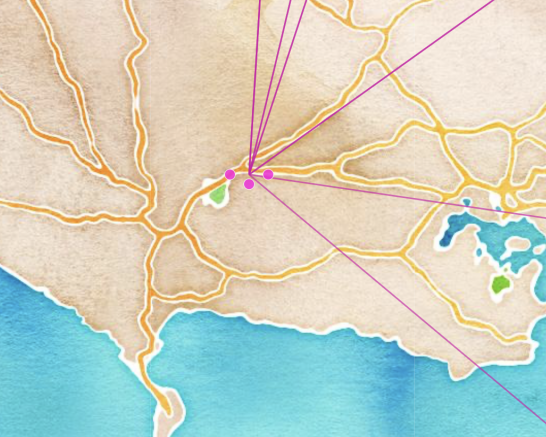
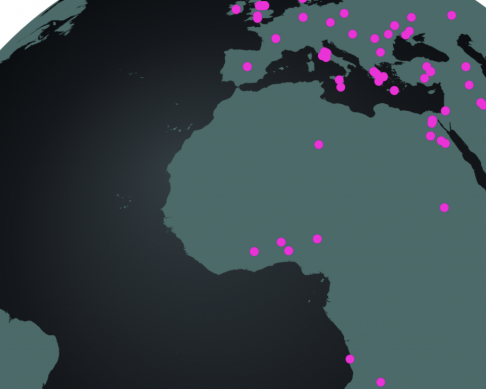
    Is a map a data visualisation? Well, it is when you use D3. In these iterations, MapLibre provides the underlying mapping system, while D3 enables the visualisation and interaction. Here, geographical locations take centre stage, revealing patterns and relationships that might otherwise remain hidden. Unlike the other diagrams, geography provides an organising structure independent of how I choose to categorise the data.

    Below, I have the full list of meaningful iterations. I will not attempt to explain every single one, as many decisions go into each iteration.


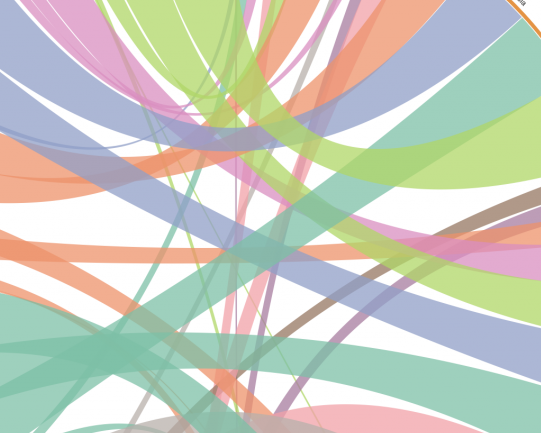
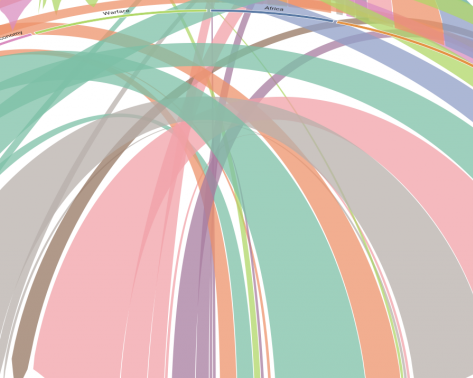
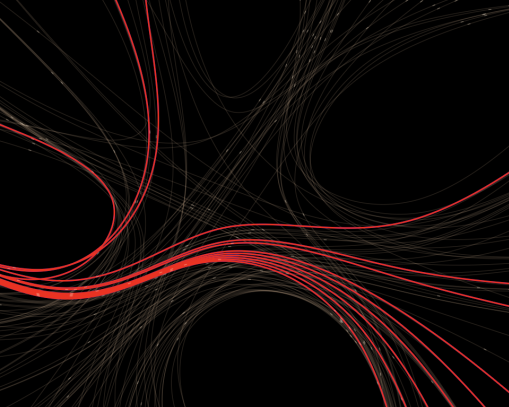
    The two visuals below were the only two iterations in which my coding errors produced a result. Coding errors usually result in a Syntax error or similar; these two produced a somewhat humorous and a strangely beautiful result.

  • Methods of Iterating: week 1

    Methods of Iterating: week 1

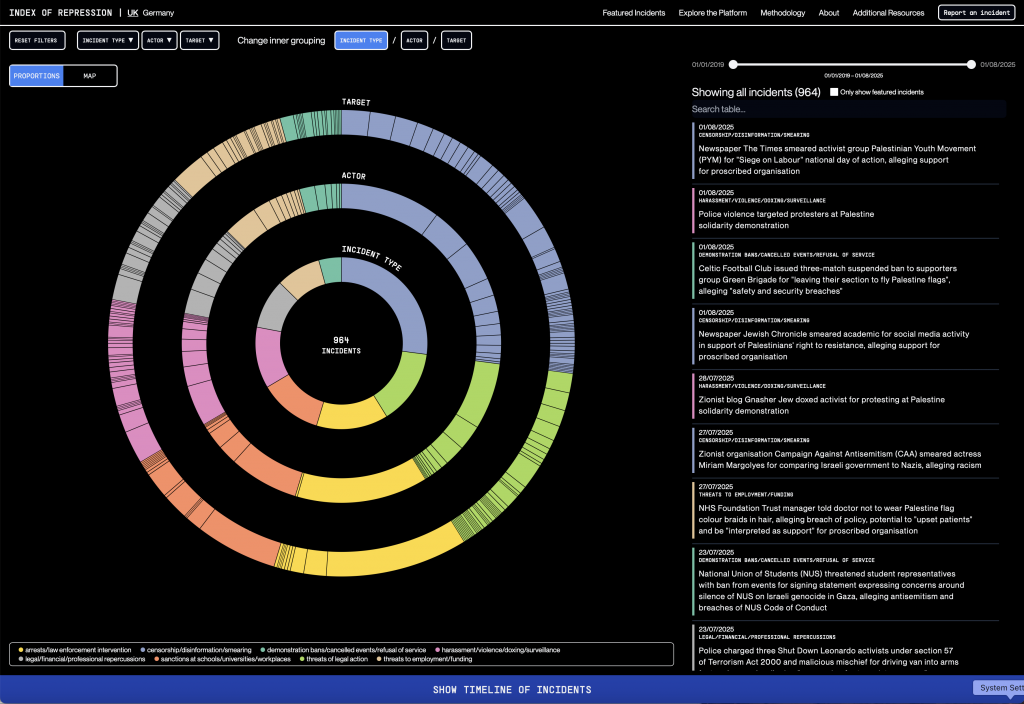
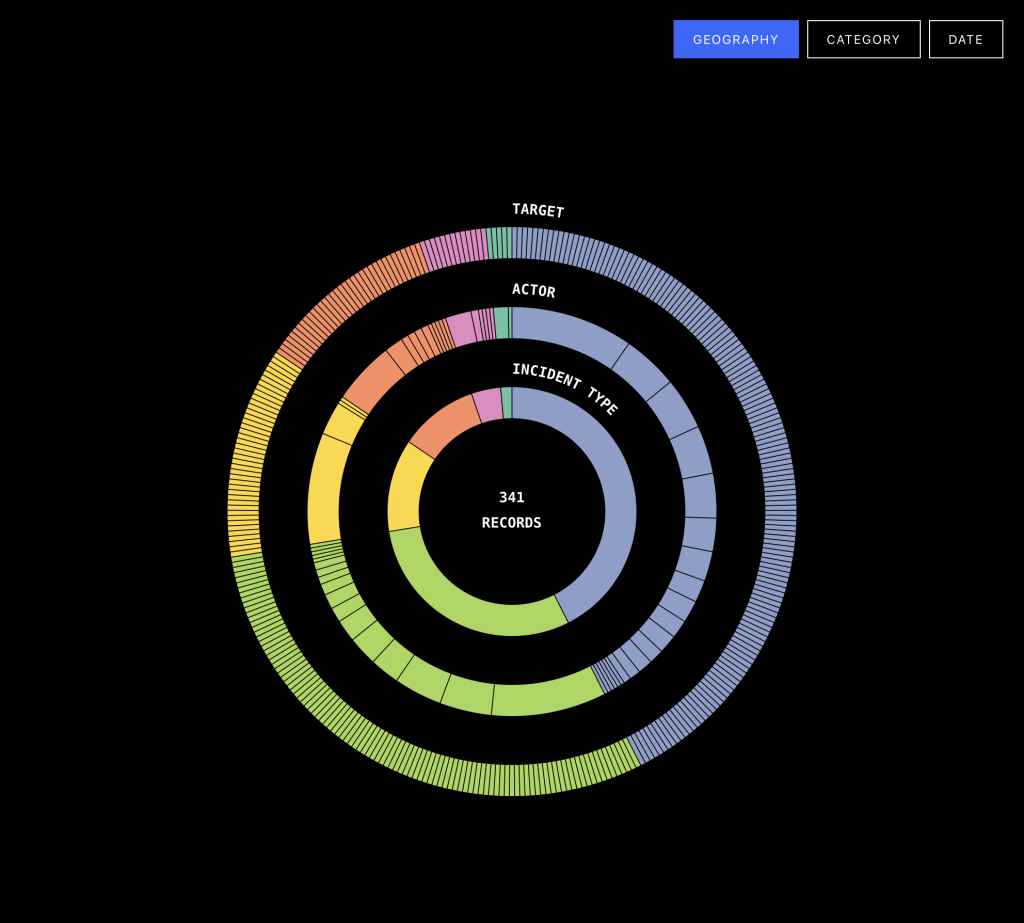
    For the Methods of Iteration project, I chose the Index of Repression data visualization connected to Forensic Architecture. I chose the JavaScript library D3.js to recreate it.


    I am surprised by how close I was able to get the design to the original target. Although D3.js is a tool with a considerably steep learning curve, with some AI help and a few false starts I have been able to make a copy with a pretty good level of accuracy. AI has been key to help me overcome the gaps in my knowledge here, but by instructing it to go step by step and only changing one thing at a time I have been able to increase my knowledge of how D3 approaches code.

    I have a basic understanding of coding through courses required at my undergraduate school, and also through making changes to websites over my career, but D3.js have a specific way of structuring things, and the level of coding knowledge you need is pretty deep.

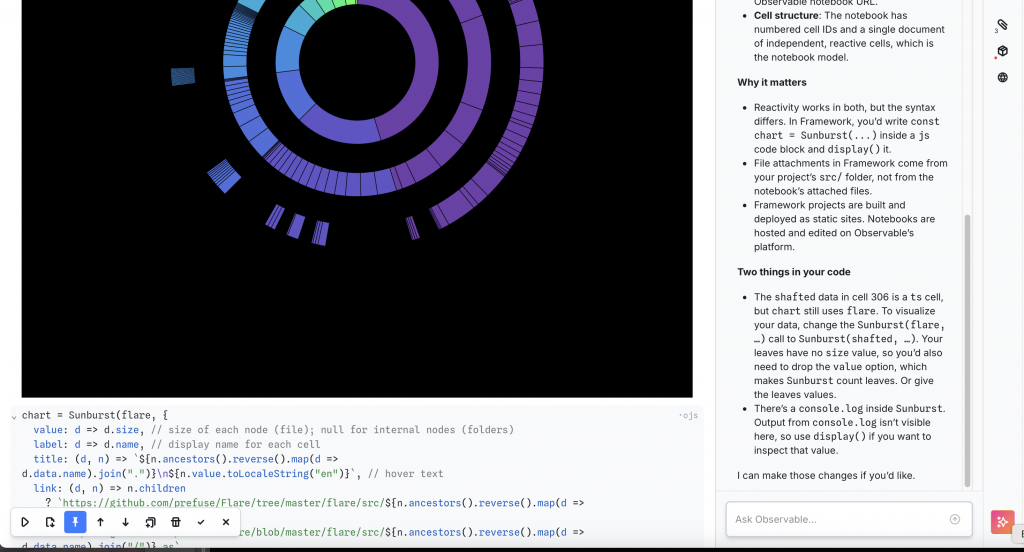
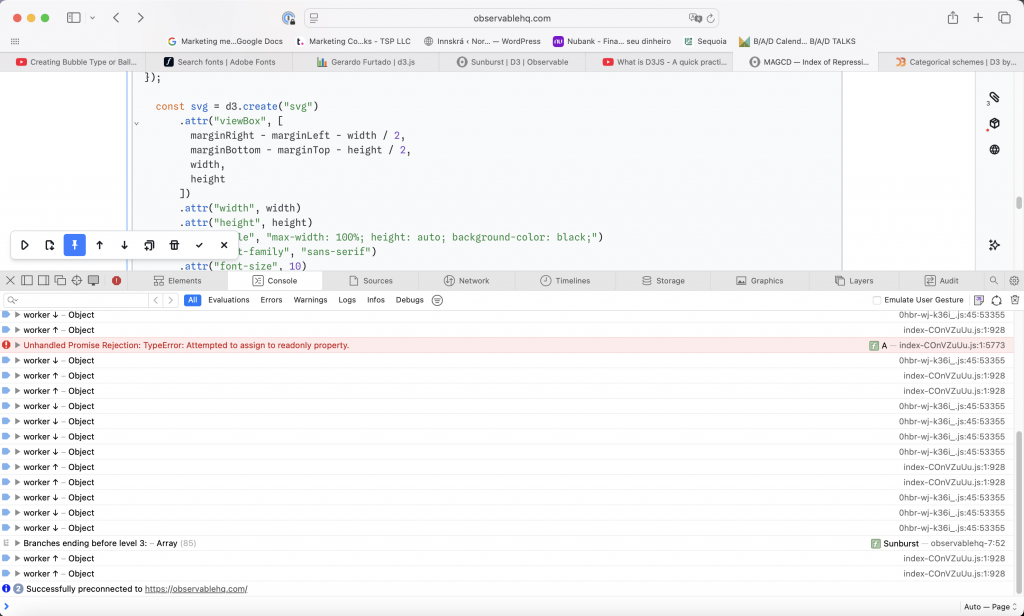
    Through the use of my step-by-step approach, I can identify where in the code certain actions live. However, I do need help with how exactly to change the code to make it do what I want it to do. I’d say the Observable platform provides a pretty good way to work with D3. It provides an interface and notebook structure where you can edit code line by line and test it in the same window.

    D3 is used by major newsrooms, and newspapers across the world. In fact if you see an impressive data visualisation it is most likely done in D3.


    To view the interactive chart, click the image above.

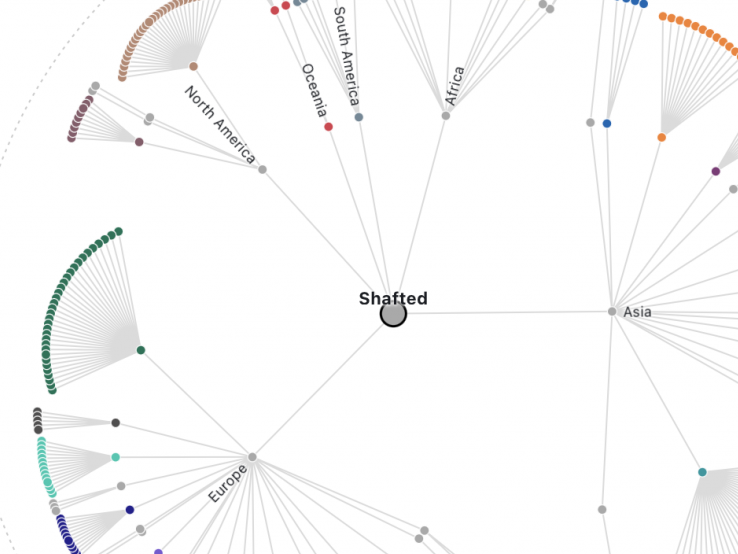
    To recreate the original as accurately as possible, I began with the closest existing example I could find in the D3 gallery. I then modified the code incrementally, adjusting the structure, proportions, colours, and interactions to bring it closer to the original Sunburst visualisation.

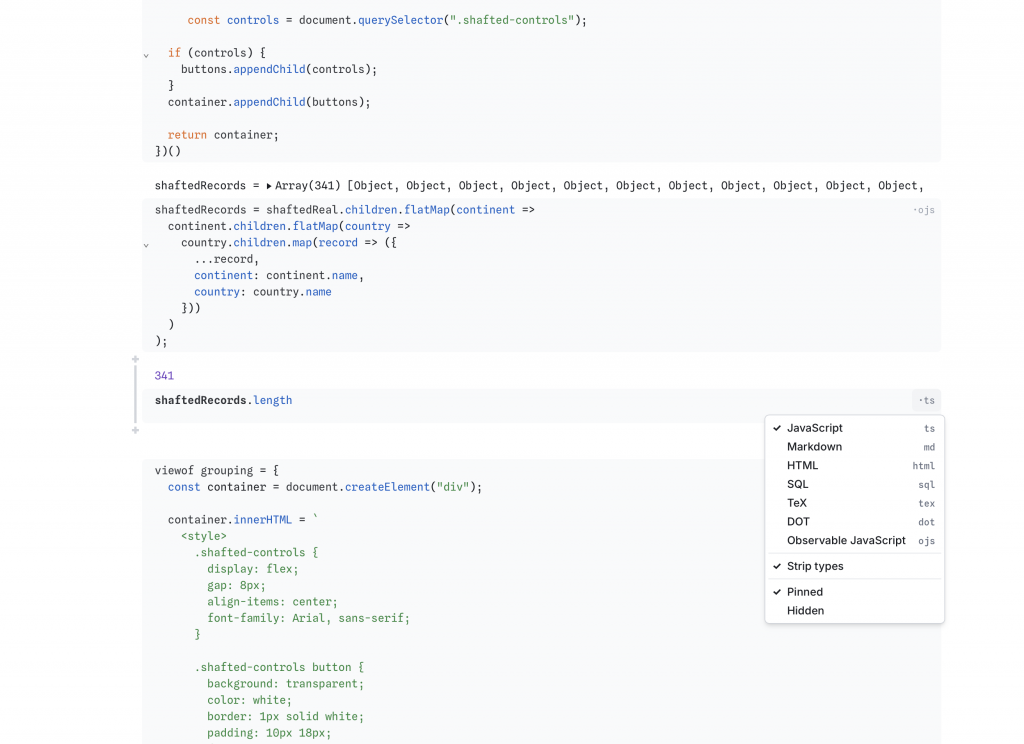
    This was easier said than done. The code is distributed across multiple cells, which must use the appropriate language and syntax as well as reference one another correctly. Although the underlying language is JavaScript, Observable introduces its own conventions for defining and sharing variables between cells. A recurring problem has been accidentally deleting too many or too few brackets, causing errors that can be surprisingly difficult to trace.

    I can now make certain adjustments independently, including changing colours, ring widths, and spacing. More complex modifications, particularly those involving interactivity, such as mouseover and mouseout events, require AI assistance. Preparing and restructuring the data has also been challenging, especially as my own dataset originates in Notion rather than a format immediately suitable for D3.

    In this project, AI has functioned as a learning tool as well as providing assistance with complicated code. By controlling the pace of the changes and testing each one, I have been able to understand more of the underlying logic, even when I cannot yet write the code independently. This approach has also made it easier to recognise when AI-generated suggestions are incorrect or introduce unexpected behaviour. The manual setting of cells and the interconnectivity of the Observable notebook mean that AI cannot do this by itself.

    For the next phase, I developed three related critical questions. The final question will form the basis of my next phase of iterations, in which I intend to explore how different visual structures influence the interpretation of the same dataset.


    To what extent does the structure of a data visualisation influence how we interpret the information it presents? Can two visualisations of exactly the same evidence tell radically different stories without either being factually incorrect?


    Can the choice of visualisation become a research method rather than simply a means of presenting research? I’m interested in using an iterative relationship between research and design, where neither is simply a stage that precedes the other.


    To what extent does data visualisation communicate what we already believe, and to what extent can it reveal what we don’t yet know? How does attaching the same data to a map/chart/scatterplots/beeswarms change what you see?

  • Written response: methods of investigating

    Written response: methods of investigating

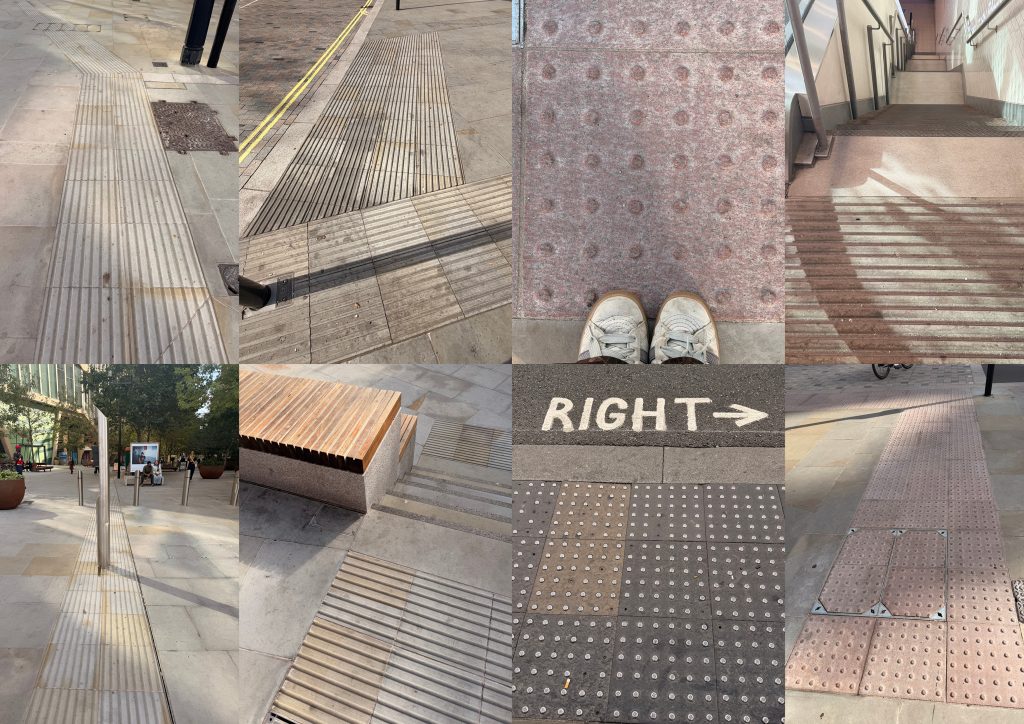
    What happens when a design intended to improve accessibility becomes an obstacle in itself? My investigation focused on the tactile paving along the upper section of King’s Boulevard, between King’s Cross St Pancras station and the Central Saint Martins campus at Granary Square.

    It didn’t take long for inconsistencies to emerge. At one point, I even questioned whether I was looking at tactile paving at all or some form of rainwater drainage.

    This brings to mind Graphic Events: A Realist Account of Graphic Design (Dyer and Deakin, 2022), which explores what happens to design once it leaves the designer’s hands. Its impact can be unpredictable, something particularly relevant to tactile paving. However, while the book encourages designers to embrace this unpredictability, that becomes problematic when accessibility is at stake. Our investigations relate in theme, but not necessarily in conclusion.

    Tactile paving was invented by Japanese engineer Seiichi Miyake to help a friend losing his sight. It was subsequently adopted worldwide, with extensive implementation guidelines. Yet King’s Boulevard demonstrates how a carefully conceived design can be compromised through its application. Crucially, these outcomes cannot all be attributed to chance. Choices were made.

    The podcast Spatial Delight, in its episode Cities for the Many Not the Few (Lisiak, 2023), discusses geographer Doreen Massey’s criticism of urban regeneration. Massey co-authored a pamphlet challenging the design-led, often elitist approach to regeneration. She argued instead for cities shaped by social empowerment, benefiting the many rather than the few. Their research process feels closely aligned with our project, particularly the importance of being physically present in the spaces and communities being investigated.

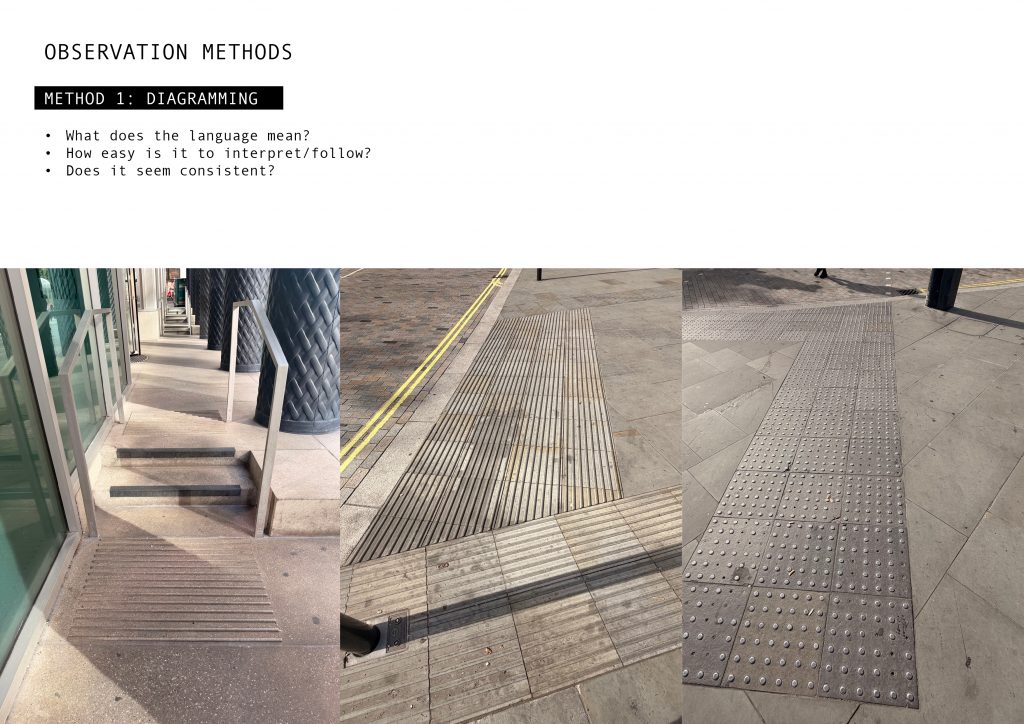
    This seems particularly relevant here. Not only does the tactile paving blend almost seamlessly into the surrounding stonework, making it difficult for partially sighted pedestrians to distinguish, but the wrong type of paving has been installed.

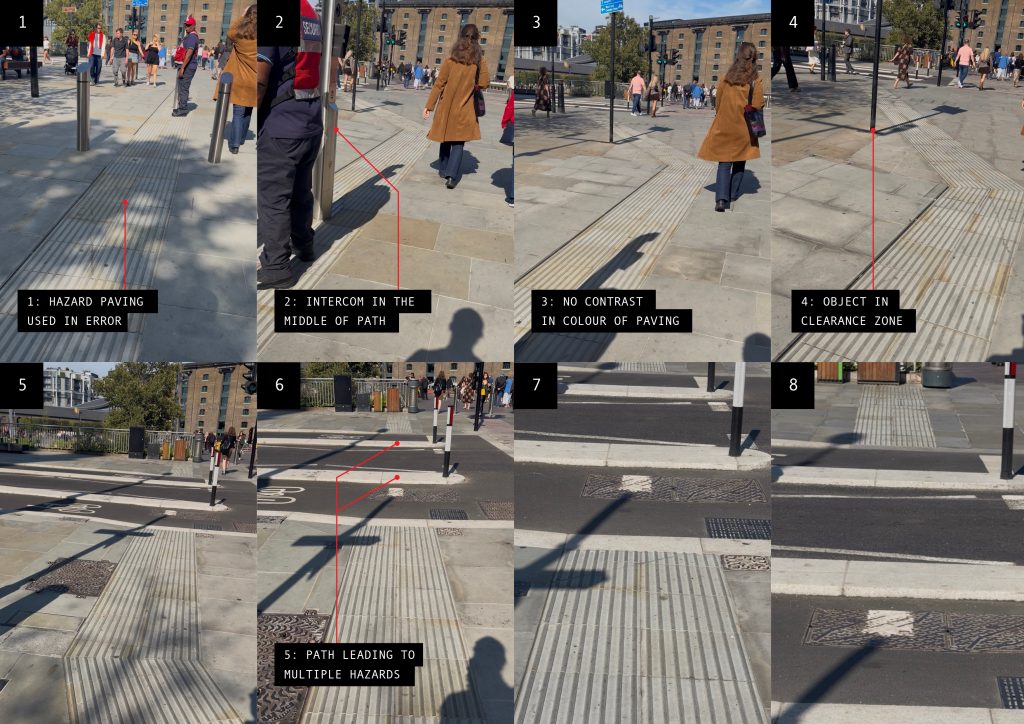
    The Department for Transport (2021, pp. 45, 71) distinguishes between corduroy hazard-warning surfaces and guidance path surfaces intended to indicate a safe route. Yet on King’s Boulevard, the former has been used in place of the latter. A design decision was clearly made, apparently favouring aesthetics over accessibility.

    Massey’s idea of ‘thrown-togetherness’, also discussed in the podcast, describes how people, materials and cultures come together to shape urban life. These relationships are influenced by power, with decisions about public space often favouring some groups over others.

    King’s Boulevard is clearly a glossy regeneration scheme, much loved and appreciated by many. So it hasn’t fallen into every trap. But more attention could have been paid to this particular accessibility measure.

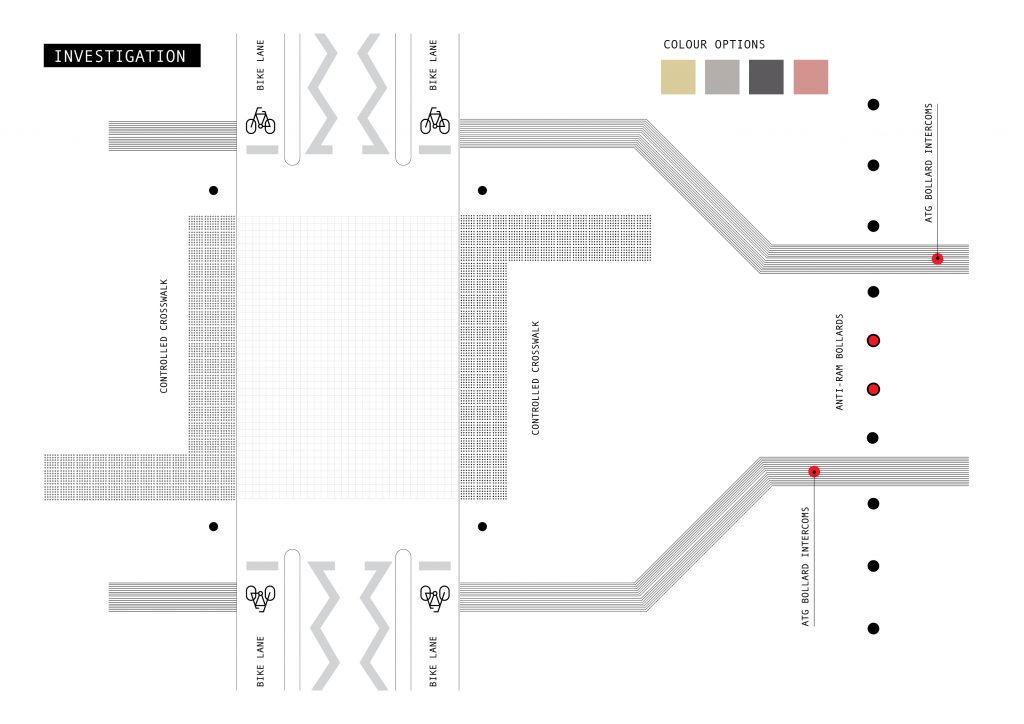
    Anti-ram bollards have also been retrofitted into the scheme, sometimes directly obstructing the tactile paving. Combined with incorrect paving patterns and the decision to match their colour to the surrounding stonework, it starts to feel like a case of form over function.

    These aren’t simply unpredictable consequences of design entering the real world. Decisions were made, apparently prioritising aesthetics and security over accessibility. Massey’s question of who the city is designed for seems particularly appropriate.

    I suspect Seiichi Miyake would not approve.

    References

    Dyer, J. and Deakin, N. (eds.) (2022) Graphic Events: A Realist Account of Graphic Design. Eindhoven: Onomatopee.

    Lisiak, Agata, host. “Cities for the Many Not the Few”, Spatial Delight, Apple Podcasts, 27 Jan. 2023, Available here.

    Department for Transport (2021) Guidance on the Use of Tactile Paving Surfaces. Department for Transport. Available here.

  • Methods of investigating

    Methods of investigating

    MAGCD Project 1: Diagramming

    It’s been a while since I’ve done something for the sake of doing something. Actively avoiding thinking about the final product or outcome is weirdly freeing and disconcerting at the same time.

    My area of investigation is the upper part of King’s Boulevard, specifically the tactile paving. I suppose it sat awkwardly with me since I walked by it the first few times. I do, of course, know what tactile paving is, but not enough to know why it felt wrong.

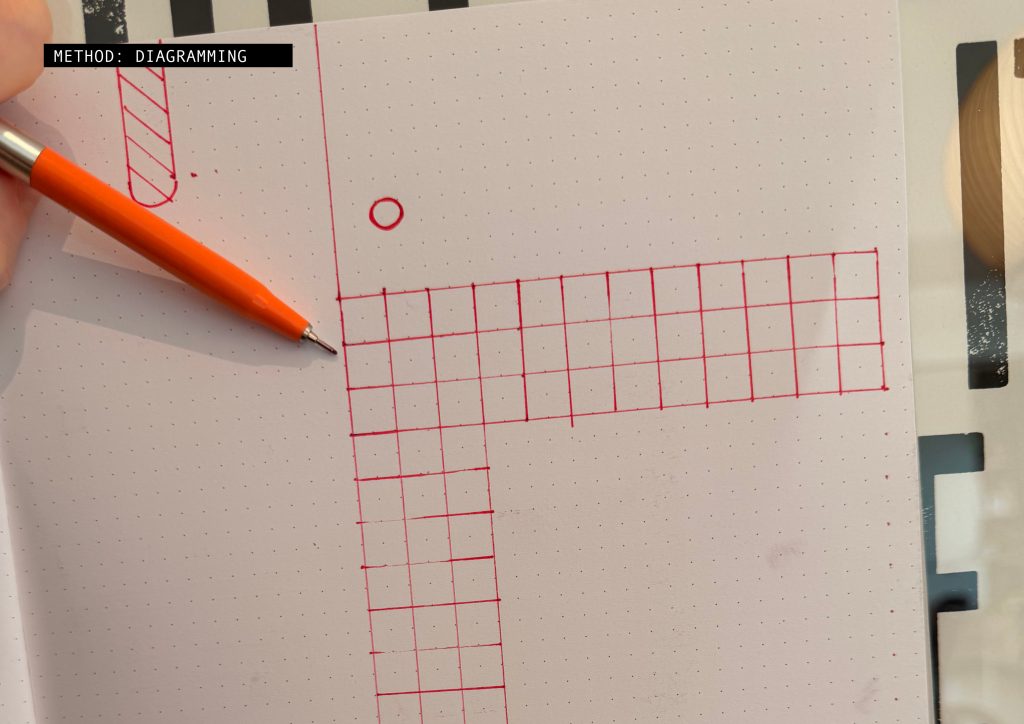
    I considered three types of investigation: photography, video, and diagramming. Diagramming proved the most revealing and aligned best with the questions I wanted to interrogate.

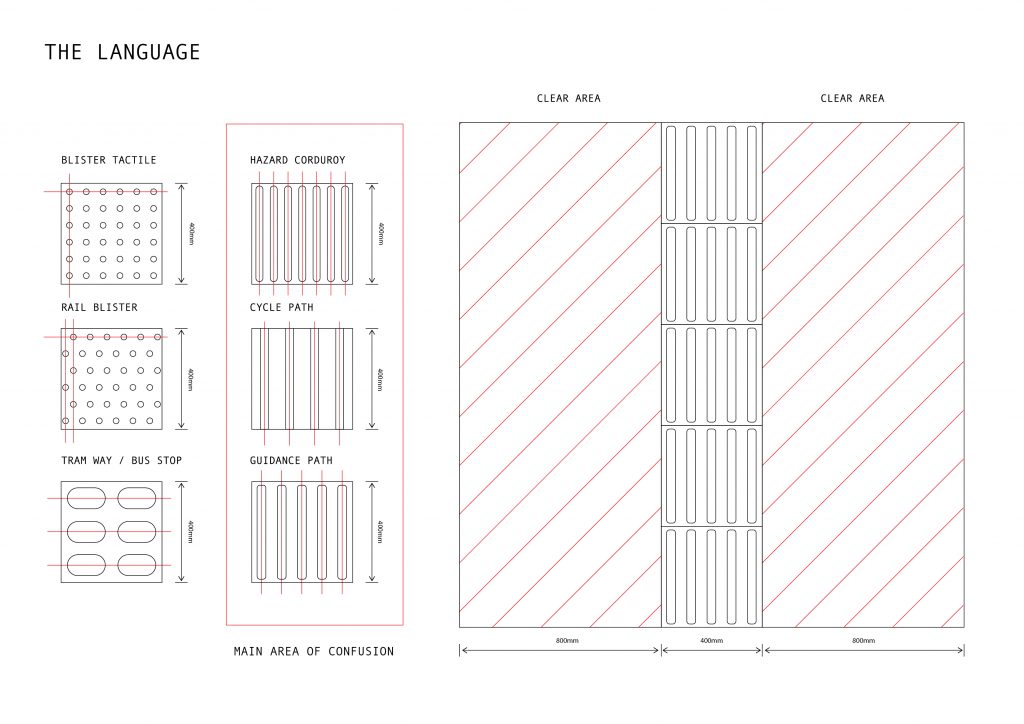
    On an unrelated note, I enjoy this language overlaid in an urban environment. I like that you mostly ‘understand’ it through your feet. I appreciate its attempt to make public spaces easier to navigate for certain parts of the population and the hidden ‘in-the-know’ aspects of it. This, however, turns out to be its downfall.

    The language itself is deceptively simple; it is, however, more complicated than I originally appreciated. The major confusion lies in the three striped versions. My area, it turns out, not only uses the wrong version, but it is also the wrong colour, or no colour at all in this case. The clear area is completely ignored.

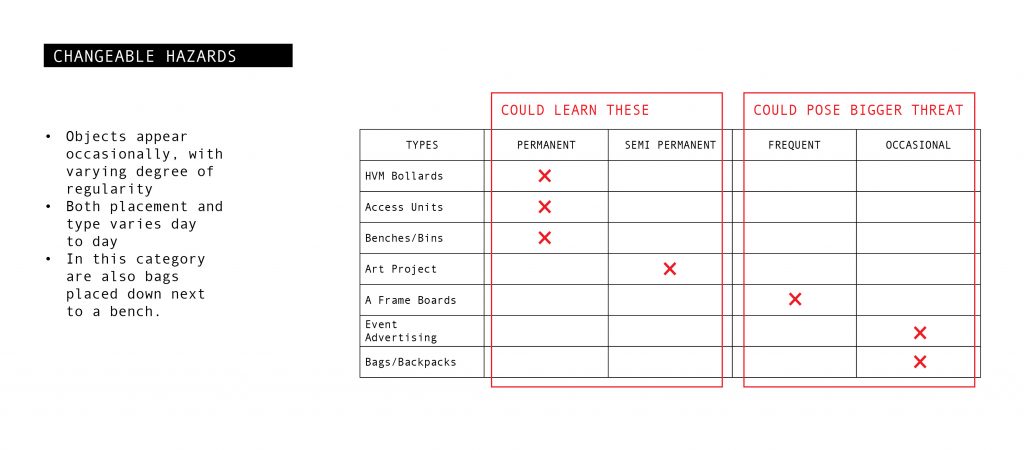
    Observing the space at different times of the week, as well as times of the day, it is not surprising that I never saw anyone use it. It is fraught with hazards, including solid objects placed directly in the line of travel. This turns out to be a known thing within this community.

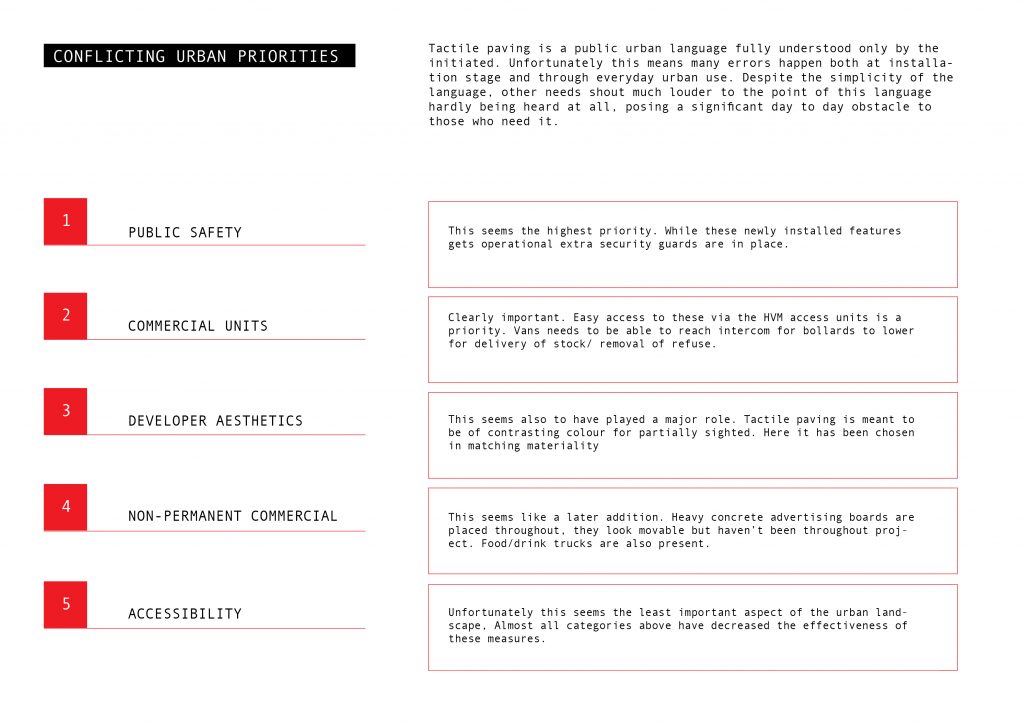
    I struck up a conversation with the security guard who looked to be ‘guarding’ one such obstacle. He was not and was unaware of the tactile paving. Instead, he was guarding the not-quite-complete anti-ram bollards. And here lies the crux of the issue. Competing priorities in an urban setting: the loudest voice is heard.

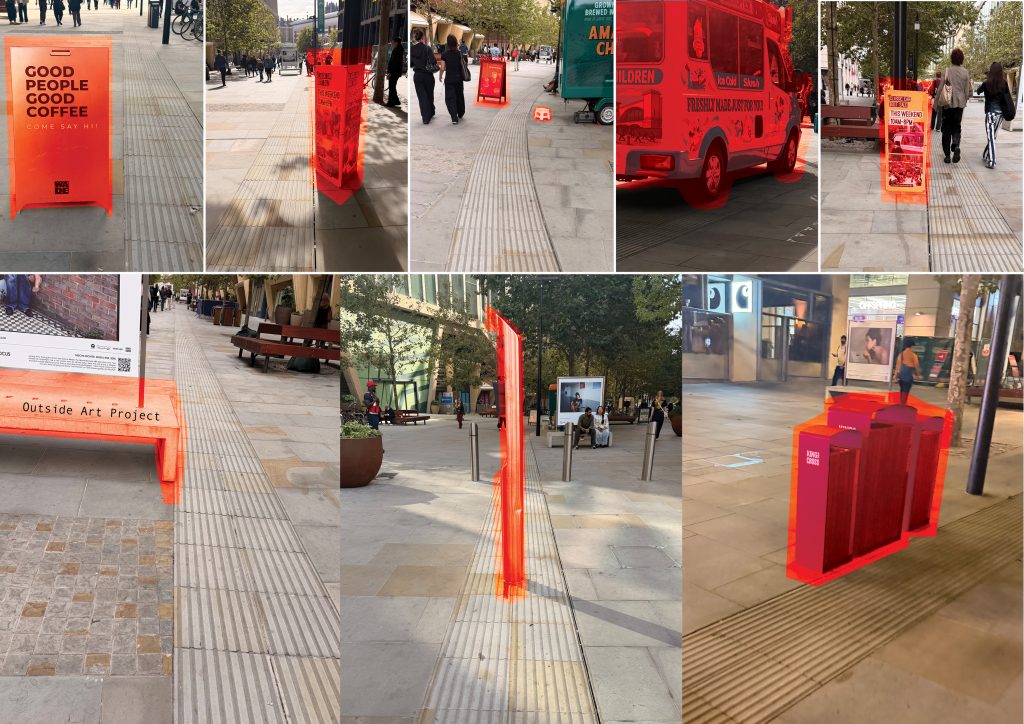
    No wonder this area had originally felt off. From paths leading directly into hazards and unpredictable objects such as advertising boards, event notices, urban art projects, refuse bins, and even ice cream trucks placed directly up against the tactile paving, there was no lack of things to pick up on.

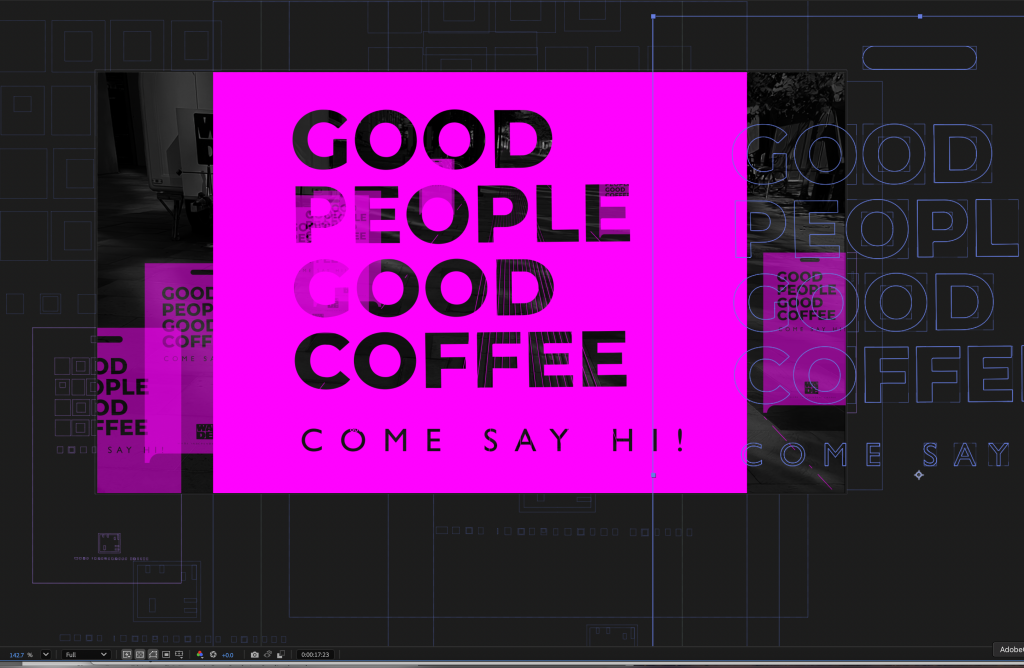
    I ended up focusing on these unpredictable yet frequent occurrences of advertising boards. I can imagine these are hard to navigate and pose extra anxiety as you navigate along a path you know hasn’t followed the rules laid out. How often do they occur? How unpredictable are they? It turns out it’s often and very.

    The anti-ram bollards and the connected intercoms were perhaps the worst offenders, but clearly the top priority in the area. These are consequences, I suppose, of being near a major transport hub and a highly frequented pedestrian area. In the hustle of big-city living, this little-known language is struggling to get heard.