
I’d like to start by debunking the idea that coding is easy. Well, more specifically, that coding is now easy with the advent of AI. Or at least it isn’t within a structure like D3.js. I feel like I am dreaming in syntax errors. All in all, I made more than 25 iterations; I will share my most meaningful ones here.
The question I chose to interrogate was: To what extent does data visualisation communicate what we already believe, and to what extent can it reveal what we don’t yet know? How does attaching the same data to a map, chart, scatterplot or beeswarm change what we see?

I was interested in whether changing the way information is presented could fundamentally change my understanding of it. Would different visualisations reveal relationships, patterns or discrepancies I hadn’t previously considered? Or would they simply reinforce the assumptions already embedded in the dataset?
I wanted to understand whether data visualisation could help challenge assumptions, or whether the process of constructing the visualisation would inevitably introduce another layer of interpretation.
I chose D3 because it was already on my radar as something that might be useful to me beyond this project. I still believe that to be true, but perhaps with some important caveats..

One of the takeaways from this project is that a library like D3 only offers endless possibilities if you know what those possibilities are and how to access them. That in itself is quite a steep learning curve. I feel like I might have cracked the door open and now have a narrow view into this world, but the sliver is still thin.
I also no longer believe that using data visualisation as a research tool will necessarily reveal things I didn’t already know. As the person preparing the data and determining how it is represented, I am inevitably influencing what I might discover. That doesn’t mean unexpected patterns can’t emerge, but perhaps its greater value lies in testing hypotheses, questioning assumptions, and identifying where further investigation is needed.
You have to make choices when preparing your data; otherwise, it is unreadable to D3. These choices are never without bias, so you are essentially determining what the visualisation can reveal and what it will obscure.

This became particularly apparent when I began comparing the different iterations. The same dataset could appear to tell quite different stories depending on whether I organised it geographically, hierarchically or through relationships. None of these representations was necessarily incorrect, but each emphasised something different. The visualisation wasn’t simply revealing the data; it was also revealing the decisions I had made about how to present it.
Even when a visualisation exposes a discrepancy I hadn’t predicted, I still don’t know how that discrepancy occurred. Is it my own bias? Is it a lack of data from the field? Is there a wider bias within the area I am studying?
All of these are further questions that the visualisation cannot answer. It can interrogate a question, but ultimately it may answer with another question, which is then up to me to interpret.
In that way, it becomes more of a dialogue. And perhaps that brings me back to where I started. D3 can generate visualisations without necessarily explaining what they reveal. It can produce results, but it can’t do the understanding for me.
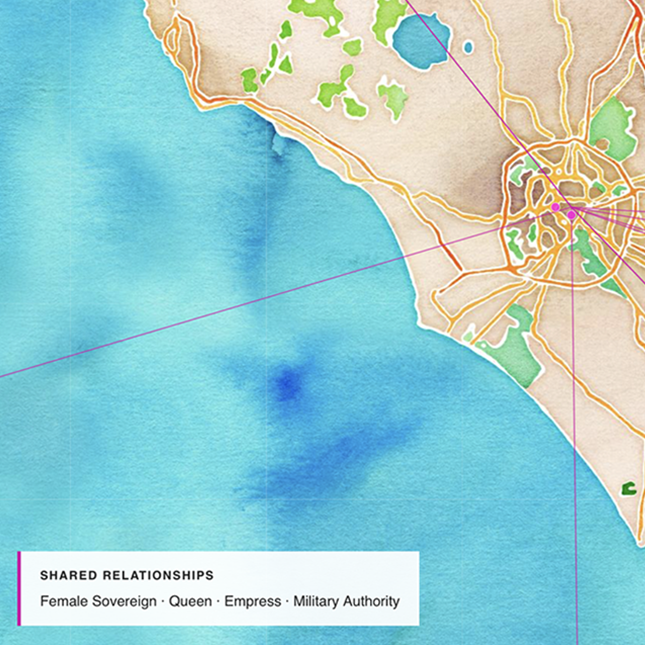
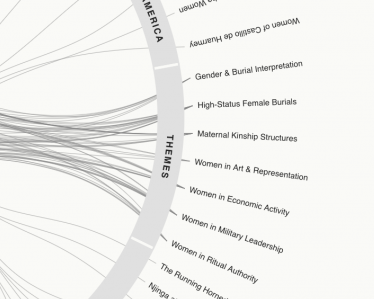
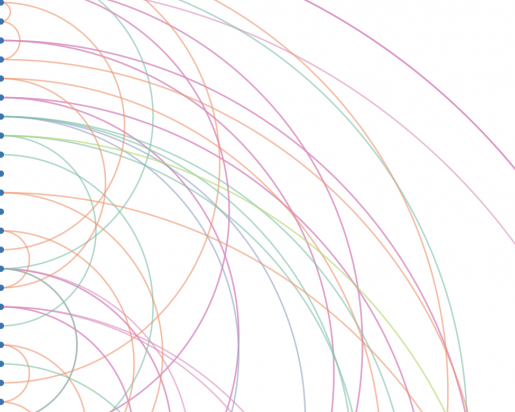
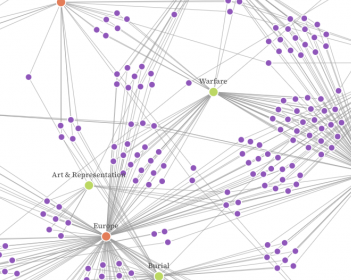
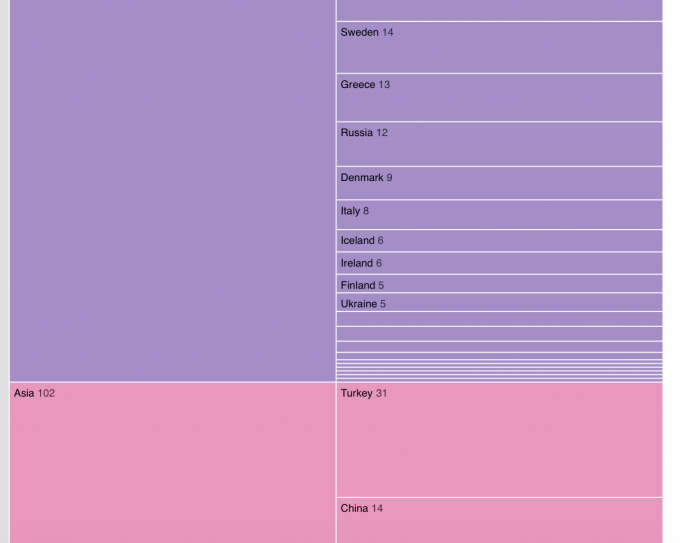
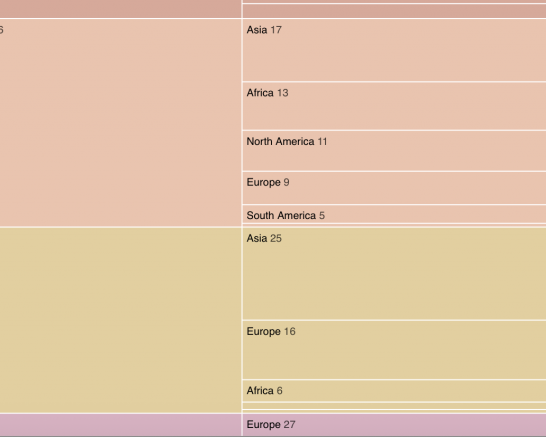
Below, I have the full list of meaningful iterations. I will not attempt to explain every single one, as many decisions go into each iteration.
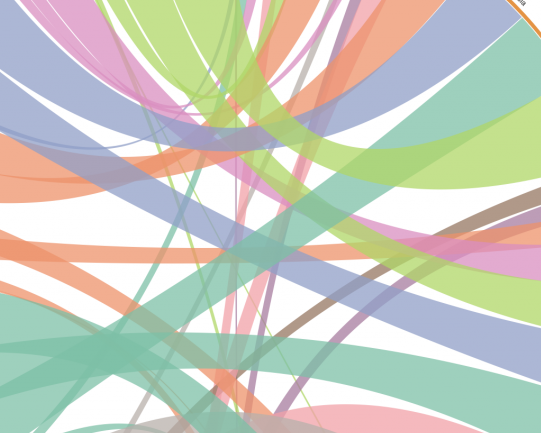
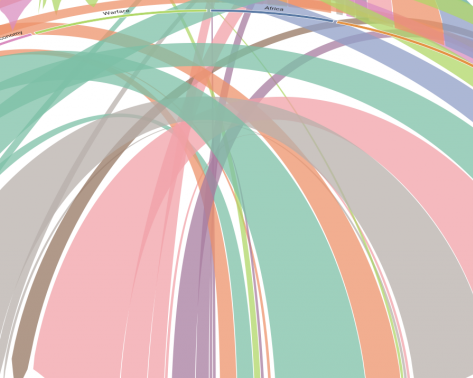


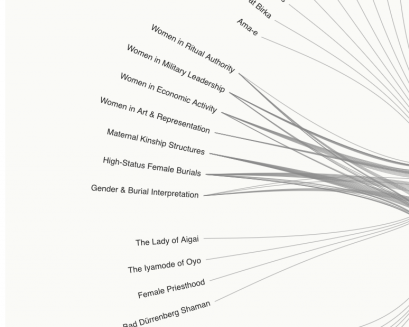
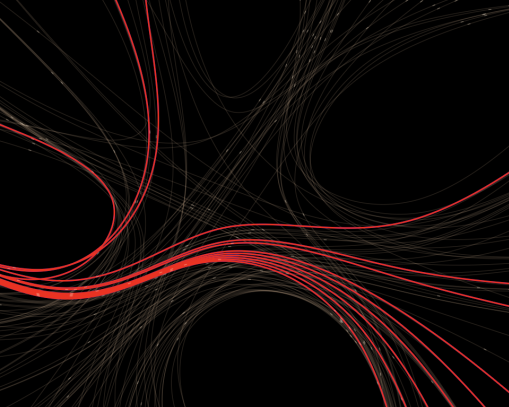
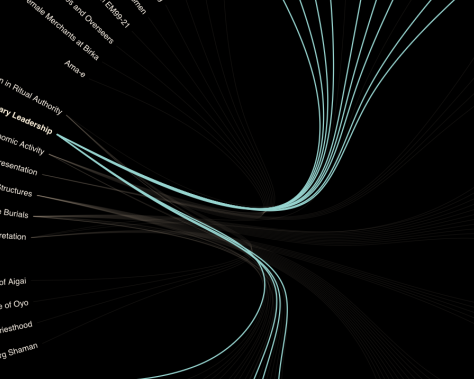
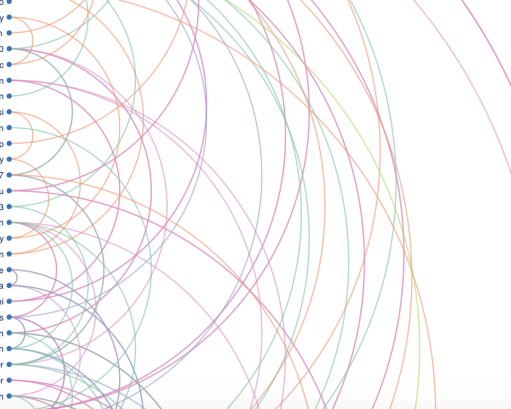

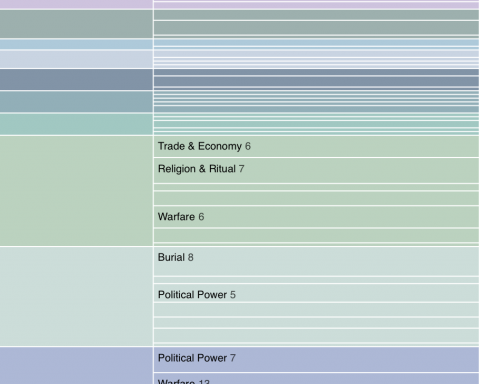
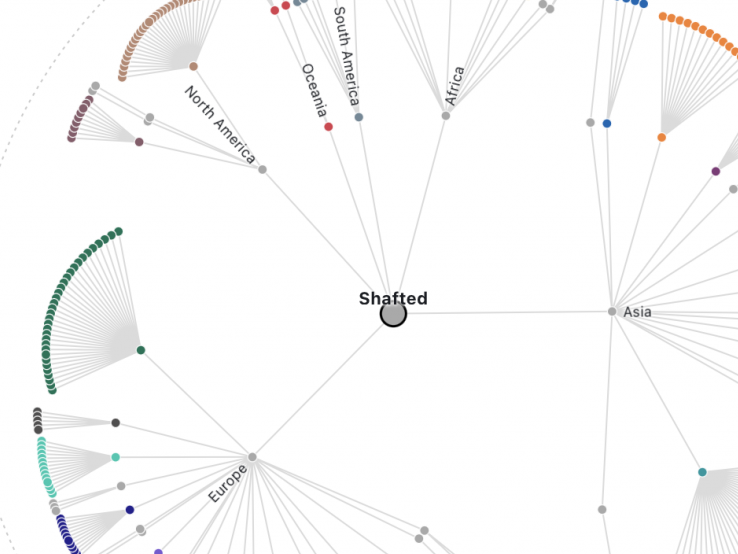
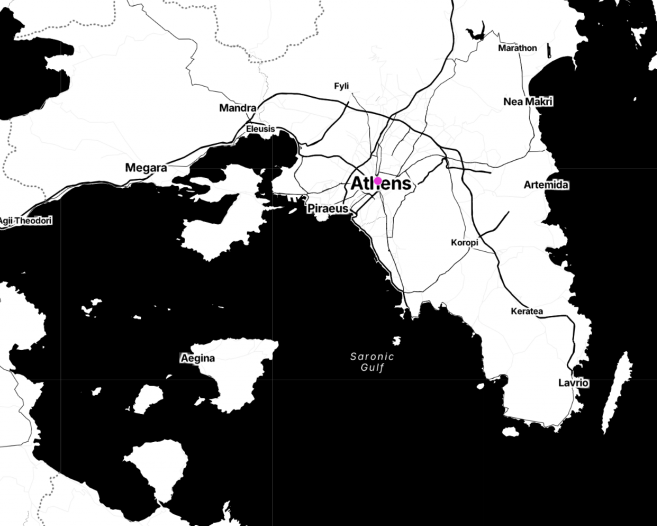
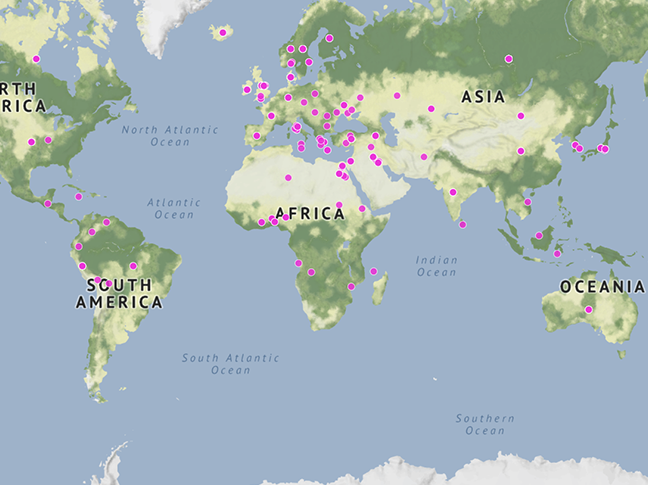
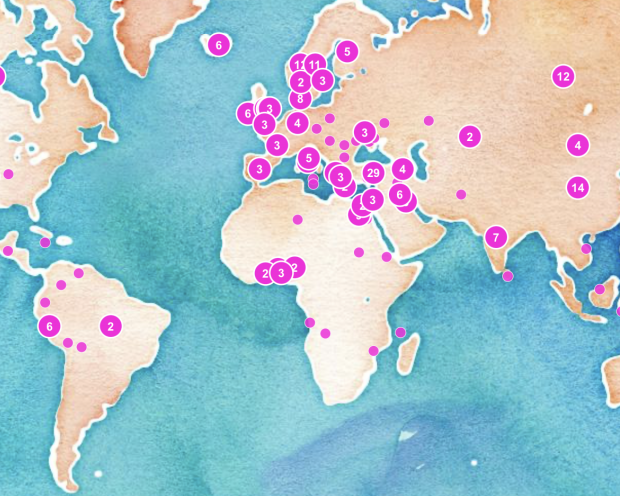
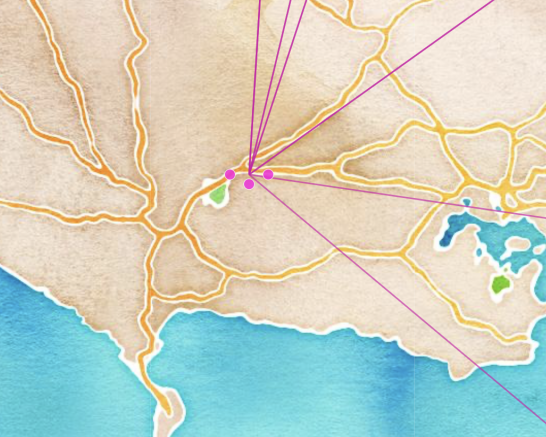
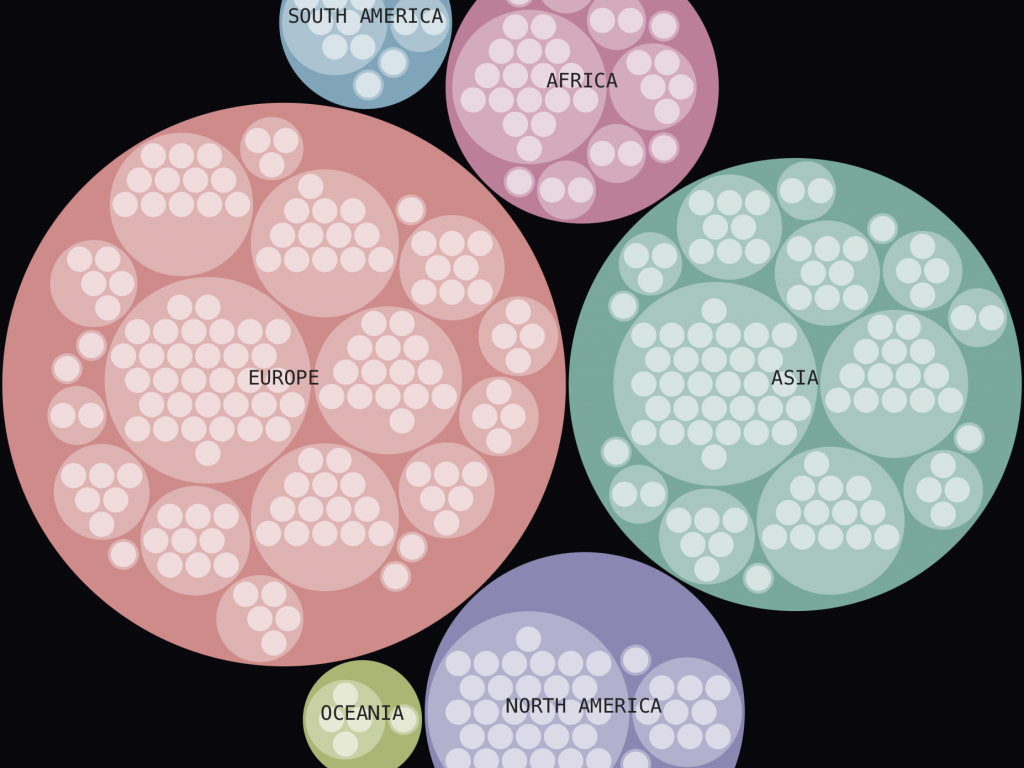
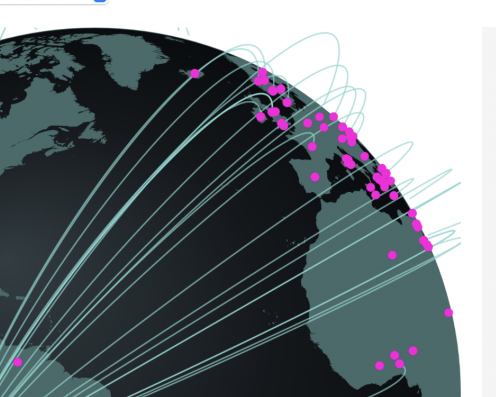
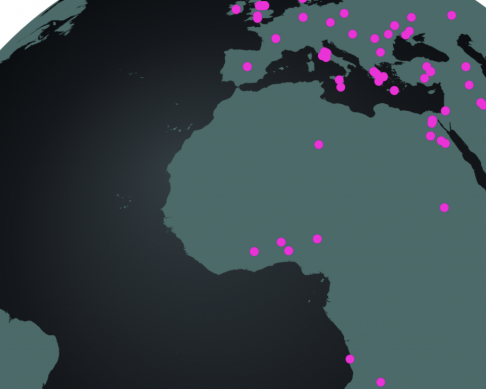
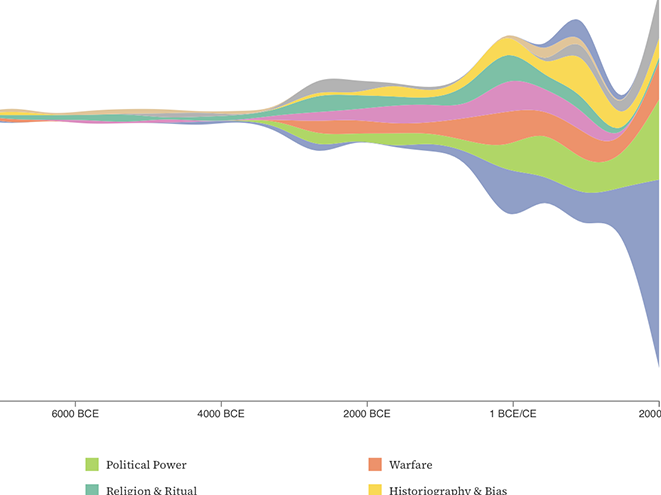
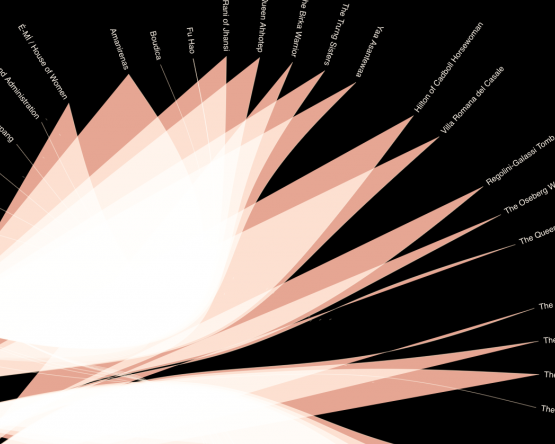
The two visuals below were the only two iterations in which my coding errors produced a result. Coding errors usually result in a Syntax error or similar; these two produced a somewhat humorous and a strangely beautiful result.

Leave a Reply